Platform Overview
Shounya
A comprehensive, Wall Street Journal-inspired stock market analysis platform. Real-time quotes, interactive charting, fundamental analysis, sector correlations, and more — all in one place.
Visit zero-sum-times.comFundamental Analysis
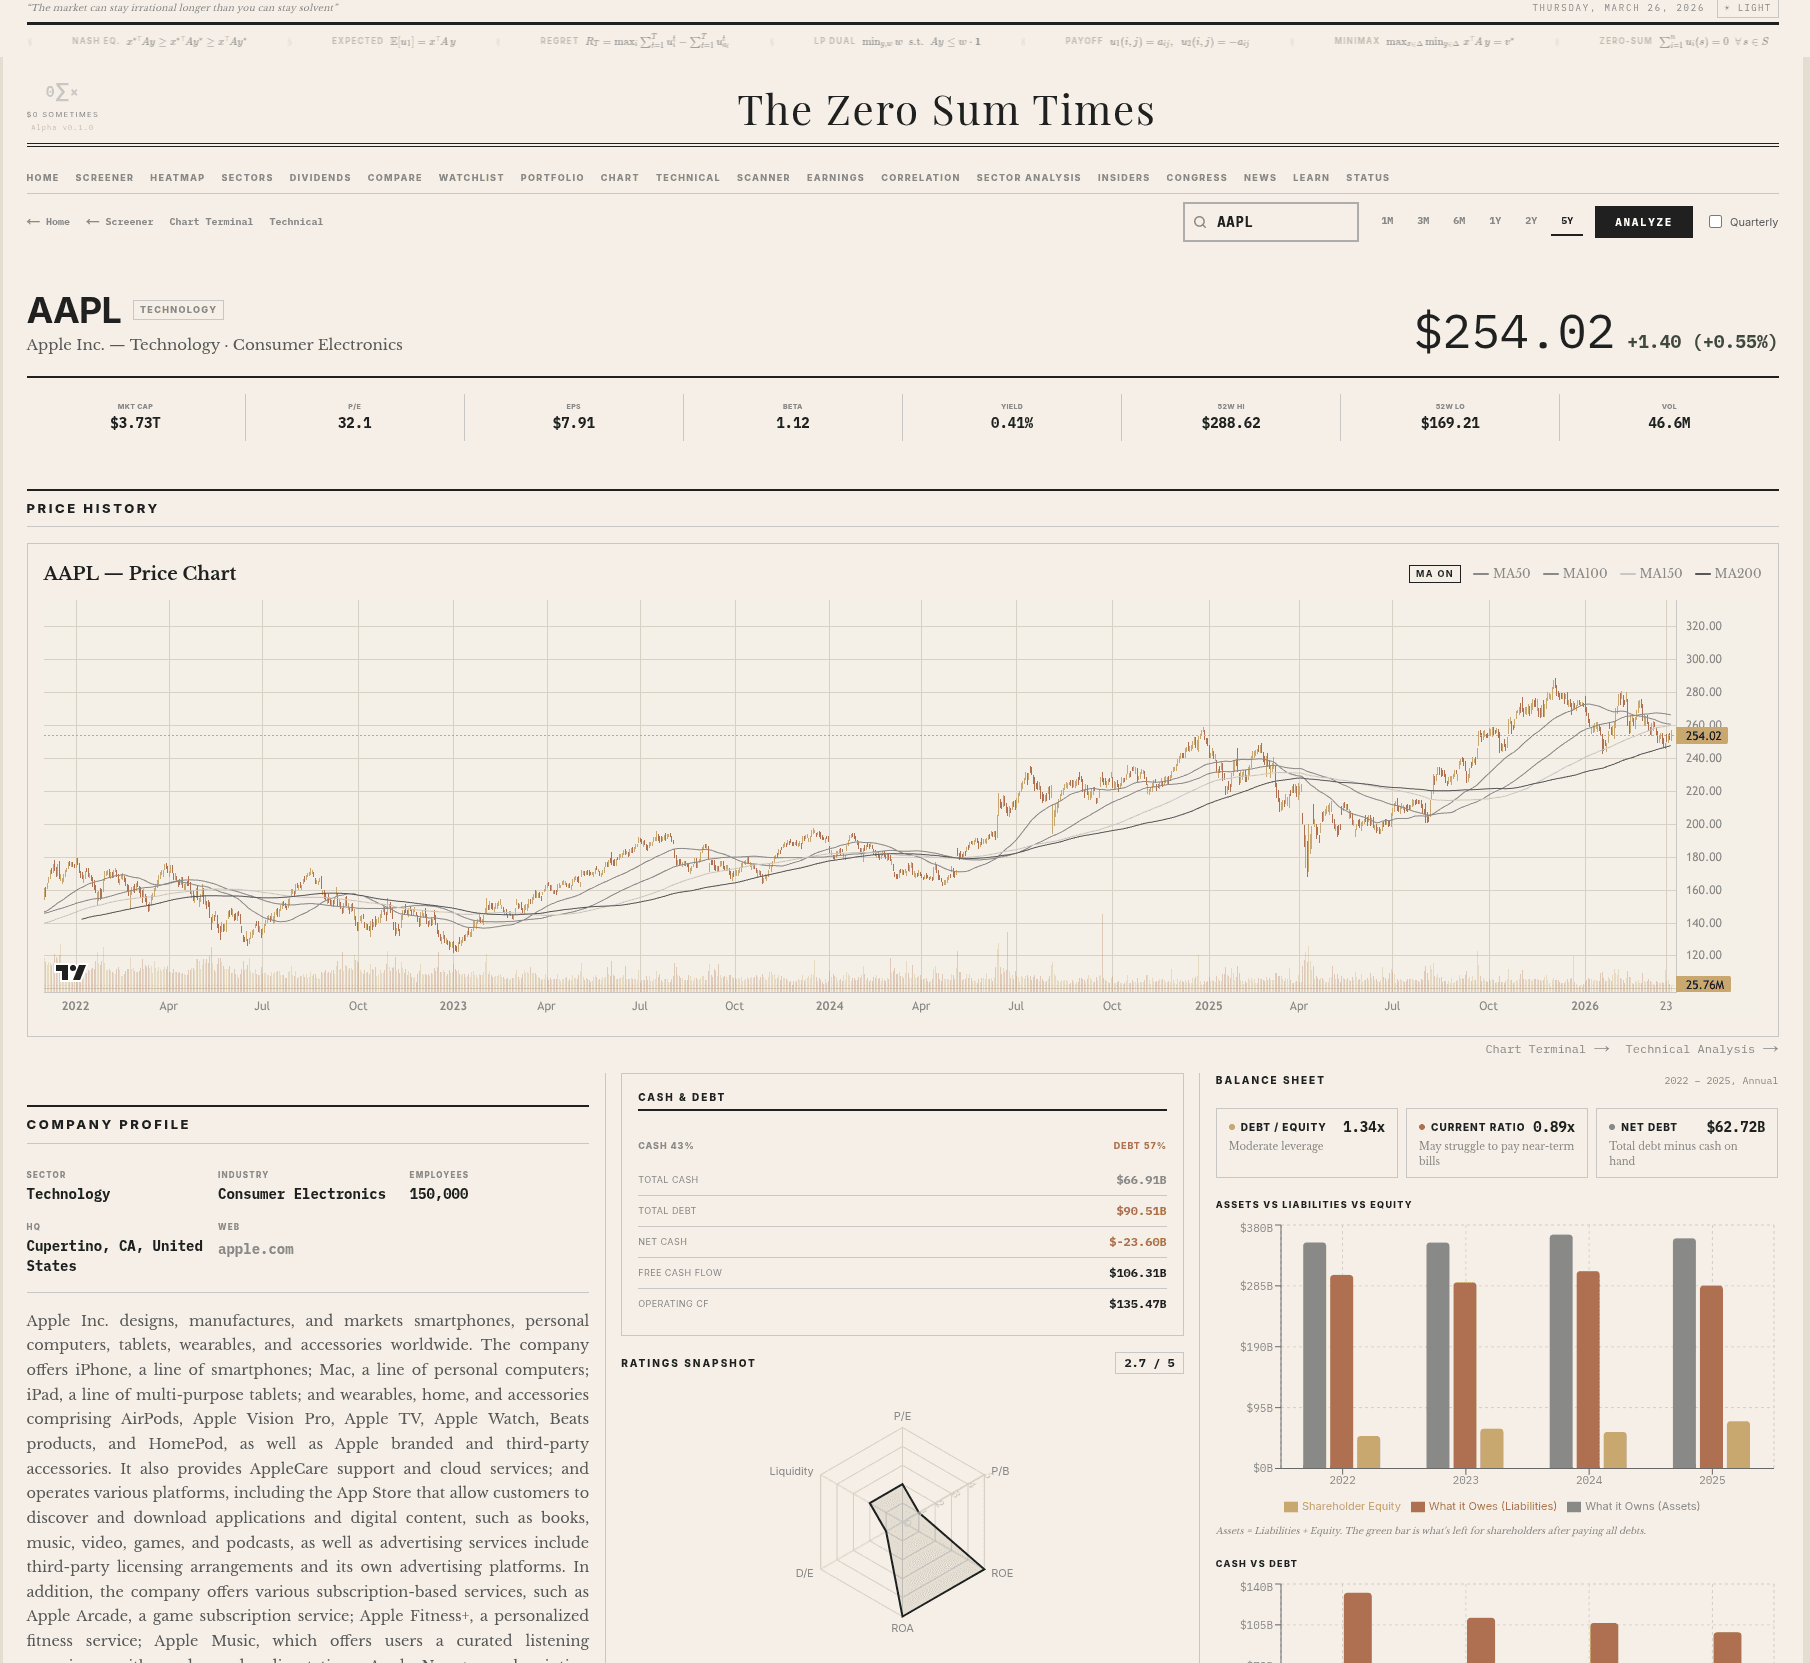
Dive deep into any stock with a full-page breakdown: price history with moving averages, company profile, cash & debt overview, balance sheet visualizations (assets vs. liabilities vs. equity), ratings snapshot radar, and cash vs. debt trends. Key metrics — market cap, P/E, P/S, beta, dividend yield, 52-week range, and average volume — are displayed at a glance.
Open Fundamental Analysis →
Landing Page & Market Dashboard
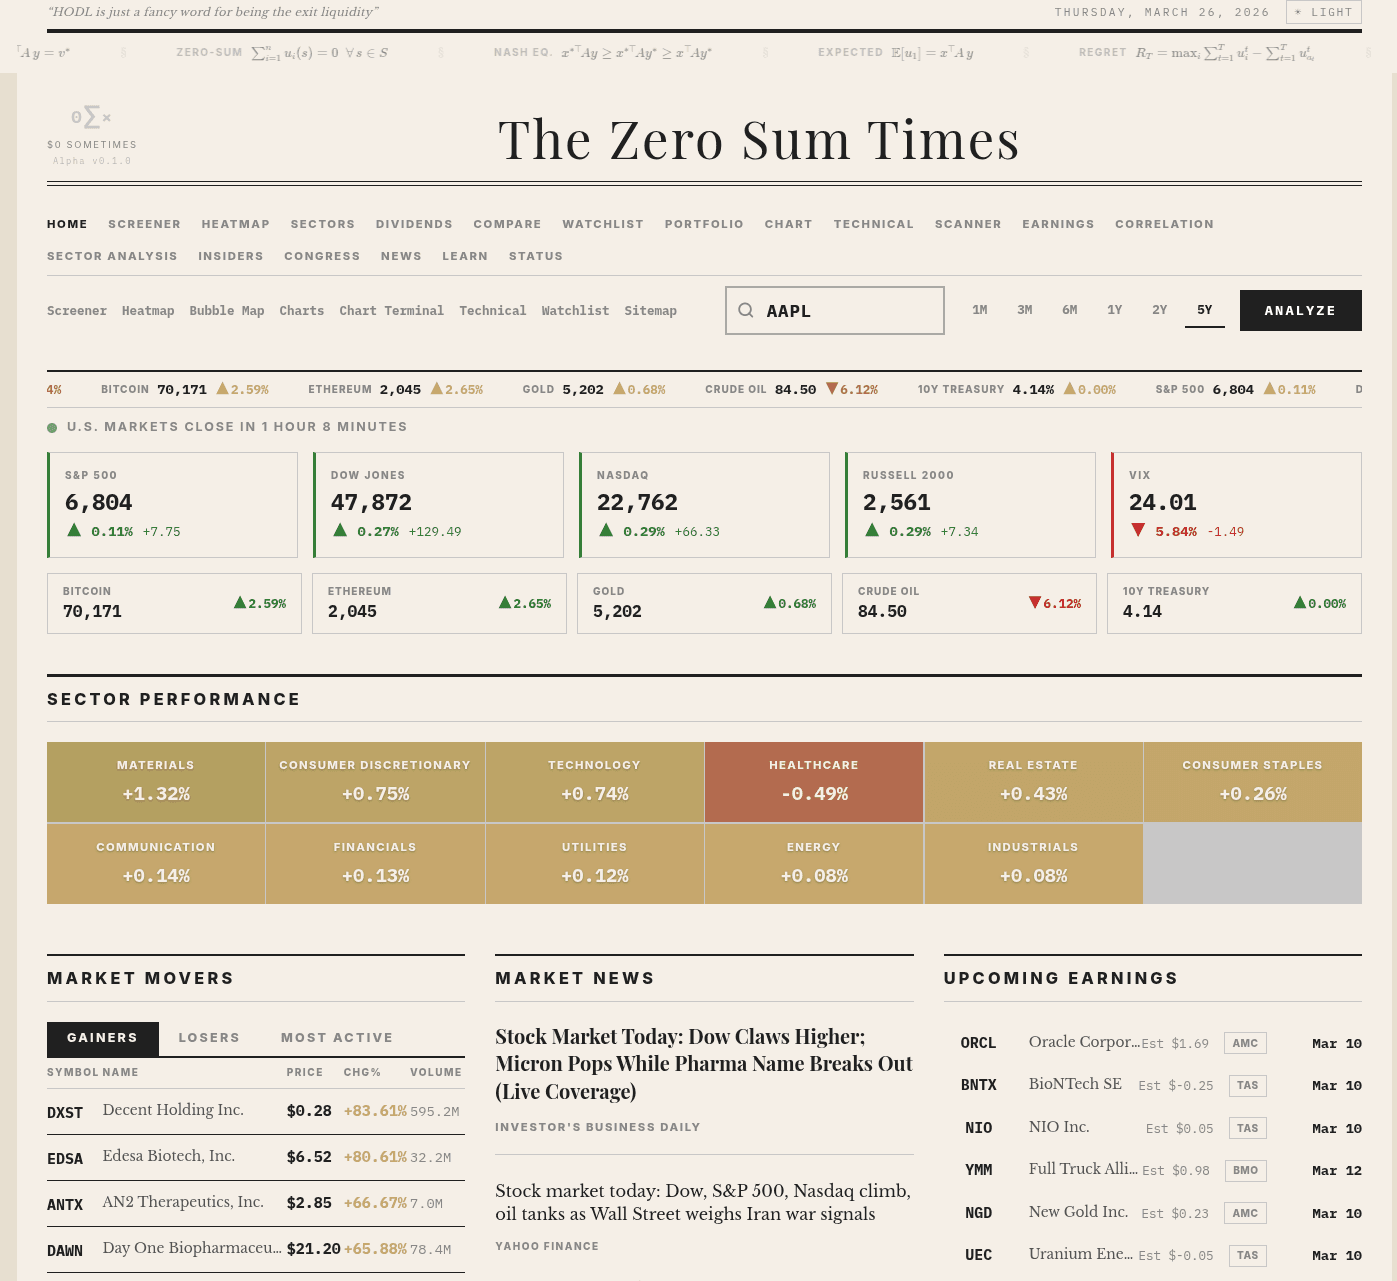
The home page provides a real-time market overview: major indices (S&P 500, Dow Jones, NASDAQ, Russell 2000, VIX), crypto & commodity tickers (Bitcoin, Ethereum, Gold, Crude Oil, 10Y Treasury), a color-coded sector performance heatmap, top market movers (gainers, losers, most active), curated market news, and an upcoming earnings calendar.
Open Landing Page & Market Dashboard →
Advanced Charting Terminal
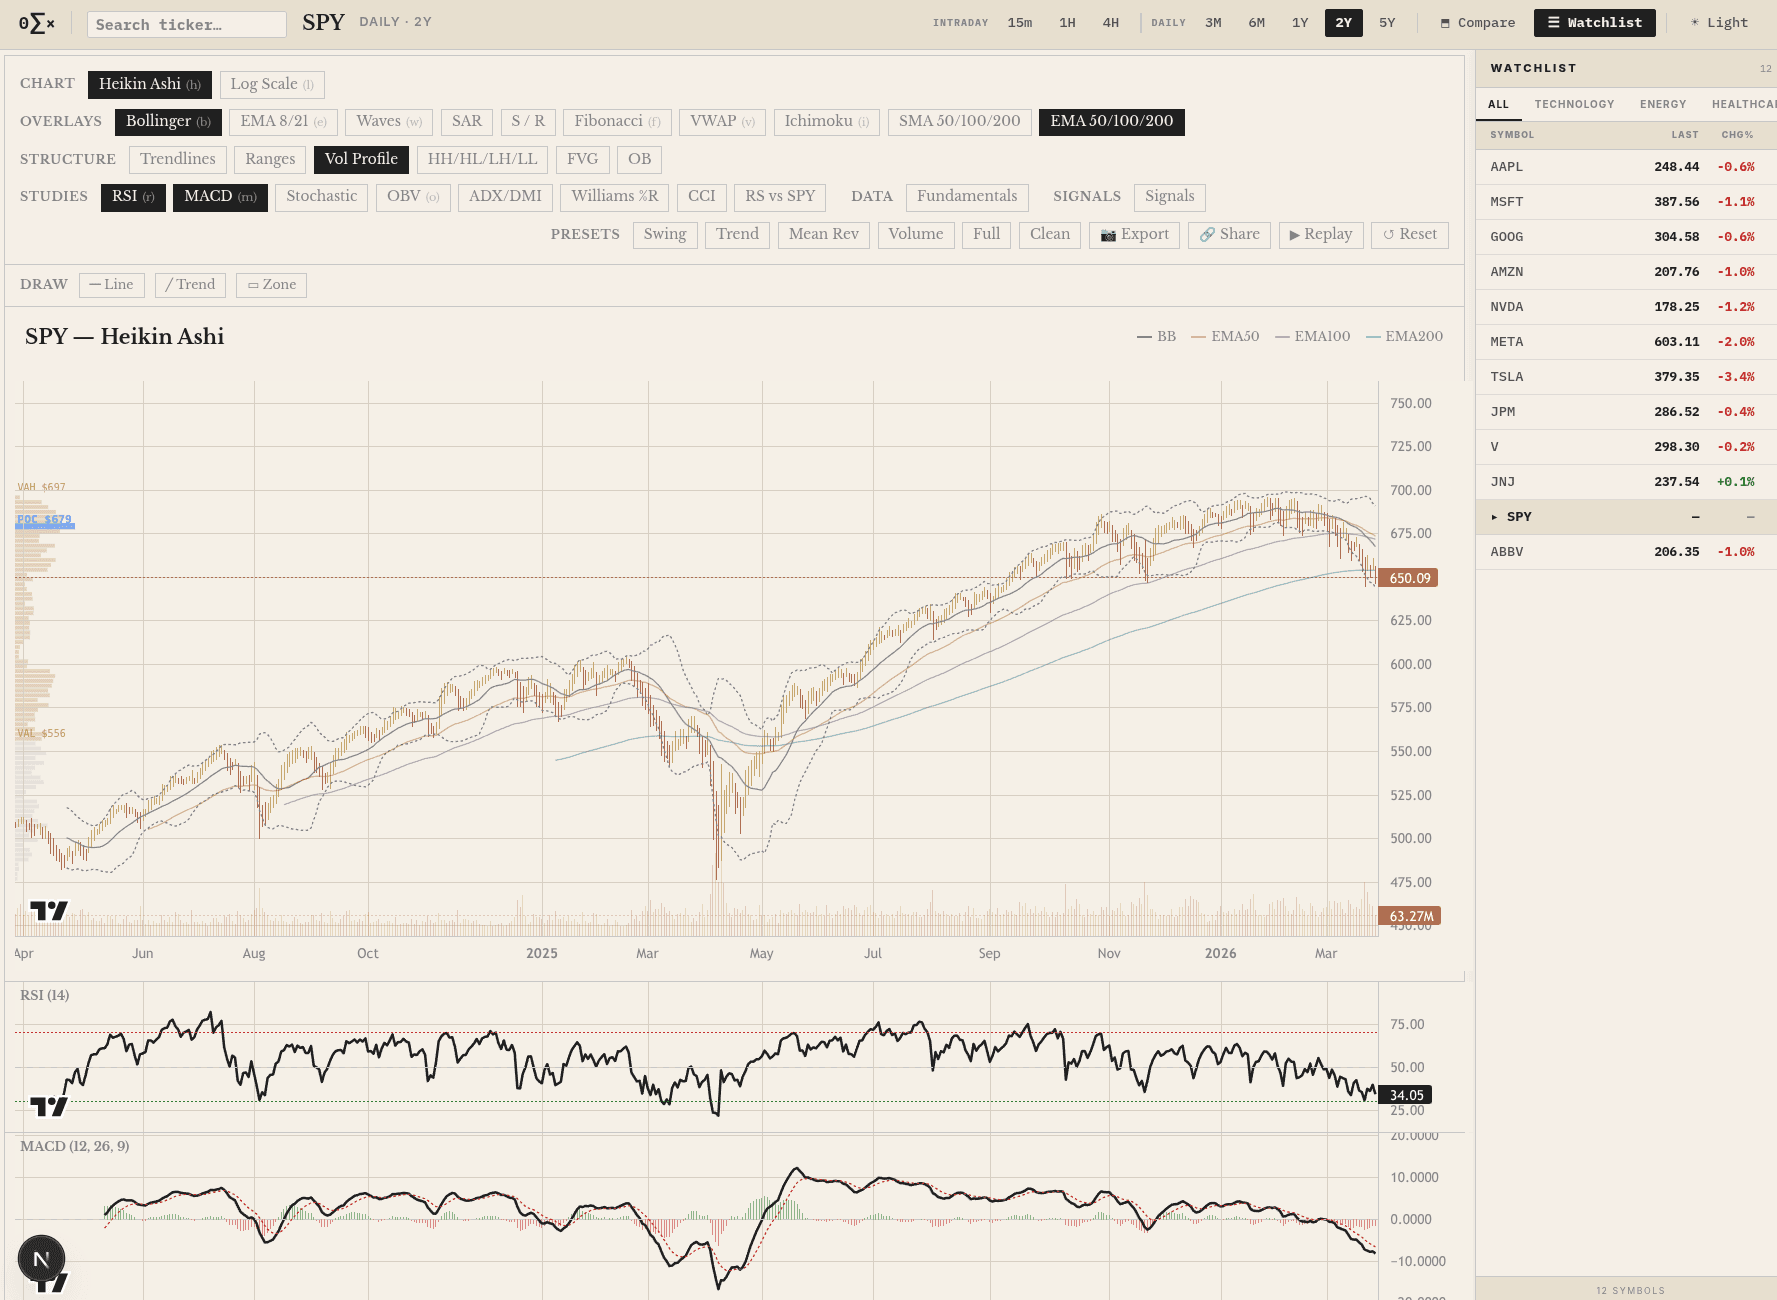
A professional-grade charting terminal with TradingView-powered interactive charts, multiple timeframes (intraday to 5Y), and extensive customization. Toggle chart types (Heikin Ashi, candlestick), overlays (Bollinger Bands, EMA, Ichimoku, VWAP, Fibonacci, SAR), structure tools (trendlines, ranges, volume profile, FVG), and studies (RSI, MACD, Stochastic, OBV, ADX/DMI, Williams %R, CCI). Includes drawing tools, chart presets, data export, and replay mode.
Open Advanced Charting Terminal →
Technical Analysis & Setup Detection
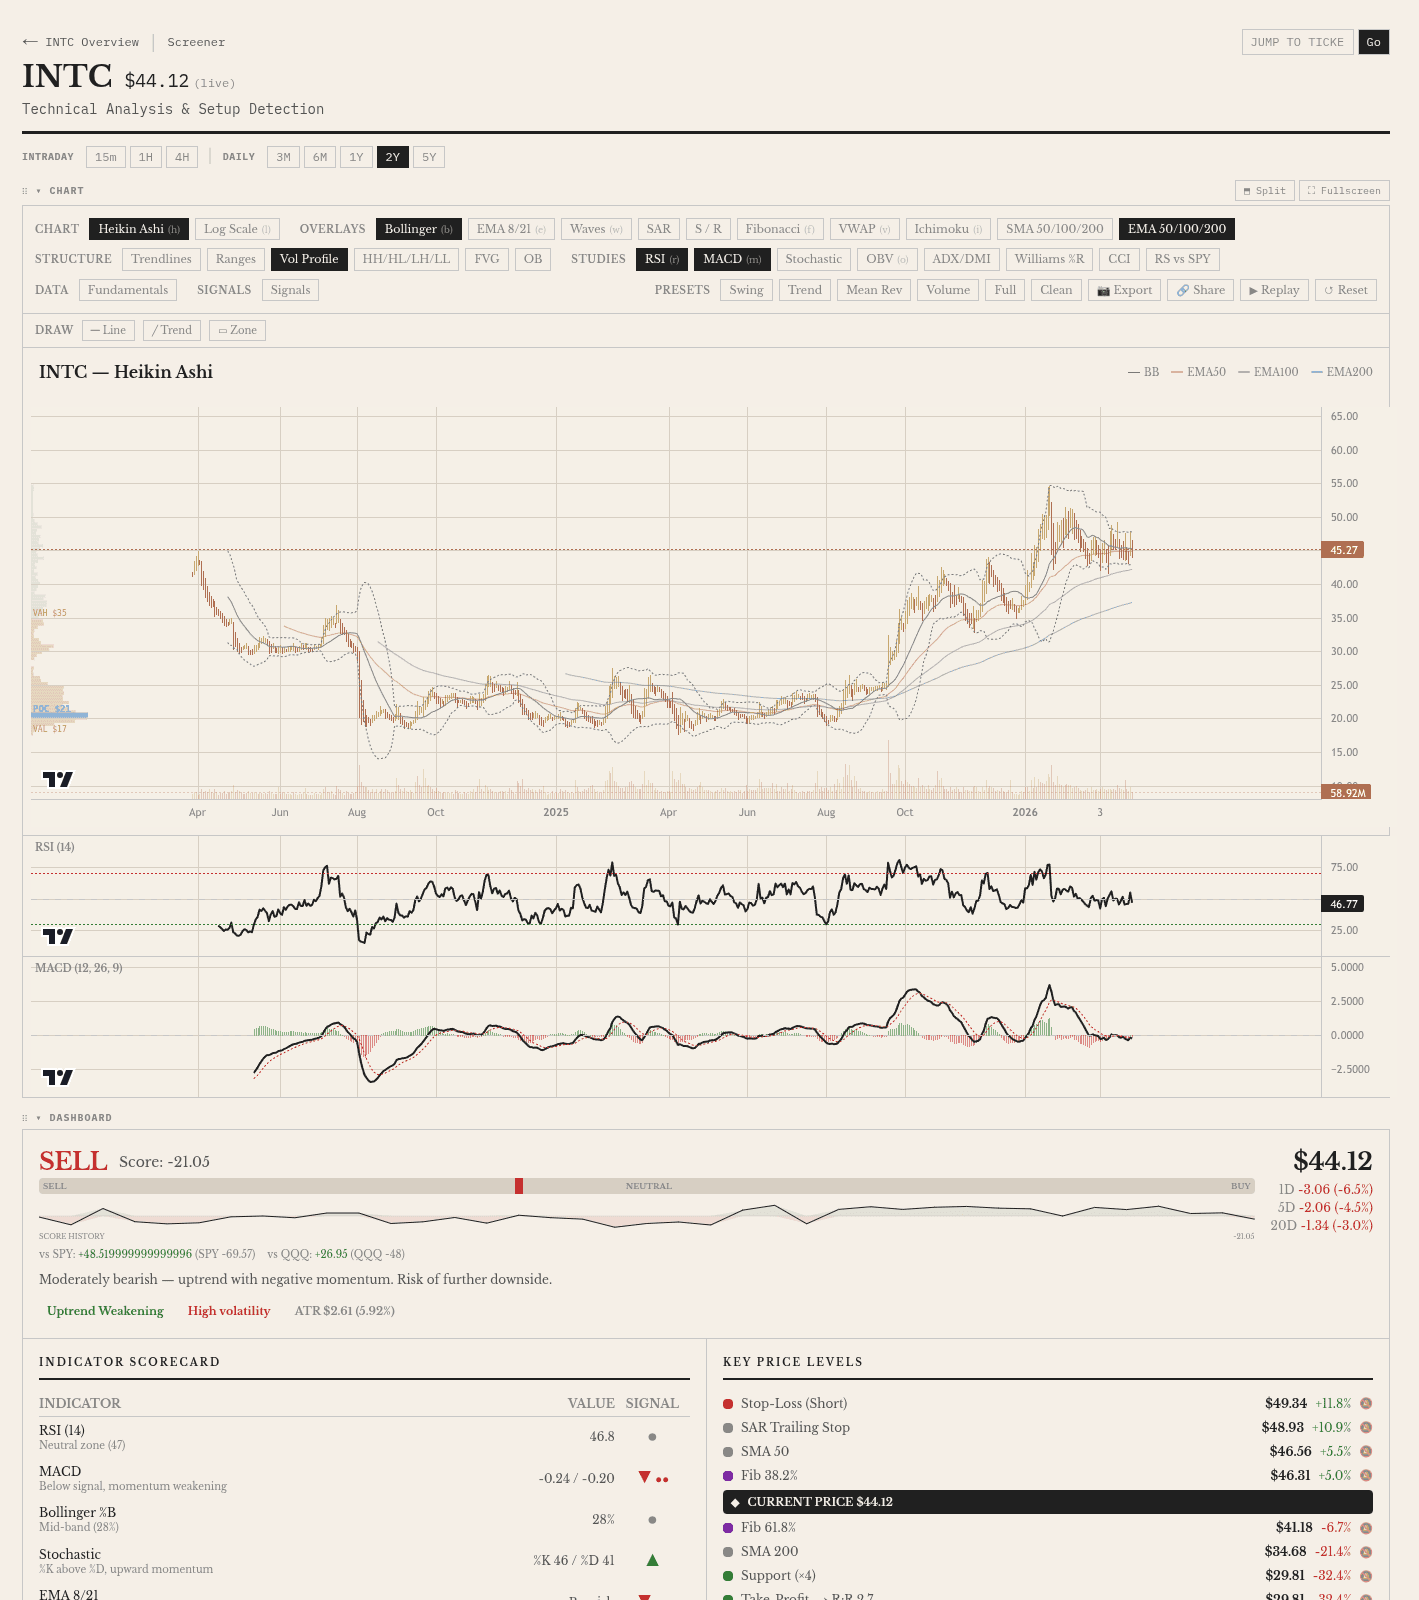
Automated technical analysis with an AI-generated scoring dashboard. Provides a composite BUY/SELL score, indicator scorecard (RSI, MACD, Bollinger %B, Stochastic, EMA), key price levels (stop-loss, SAR trailing stop, SMA, Fibonacci retracements, support/resistance), and contextual commentary on trend direction, momentum, and volatility. Compare performance vs. SPY and QQQ benchmarks at a glance.
Open Technical Analysis & Setup Detection →
Market Heatmap
An interactive treemap visualization of 500+ stocks, sized by market cap and colored by daily performance. Filter by S&P 500 or NASDAQ-100, switch between time periods (1D, 1W, 1M, YTD) and chart ranges (3M–5Y), group by sector or view flat, filter by sector, and search for any ticker. Toggle between map, sector summary, and table views.
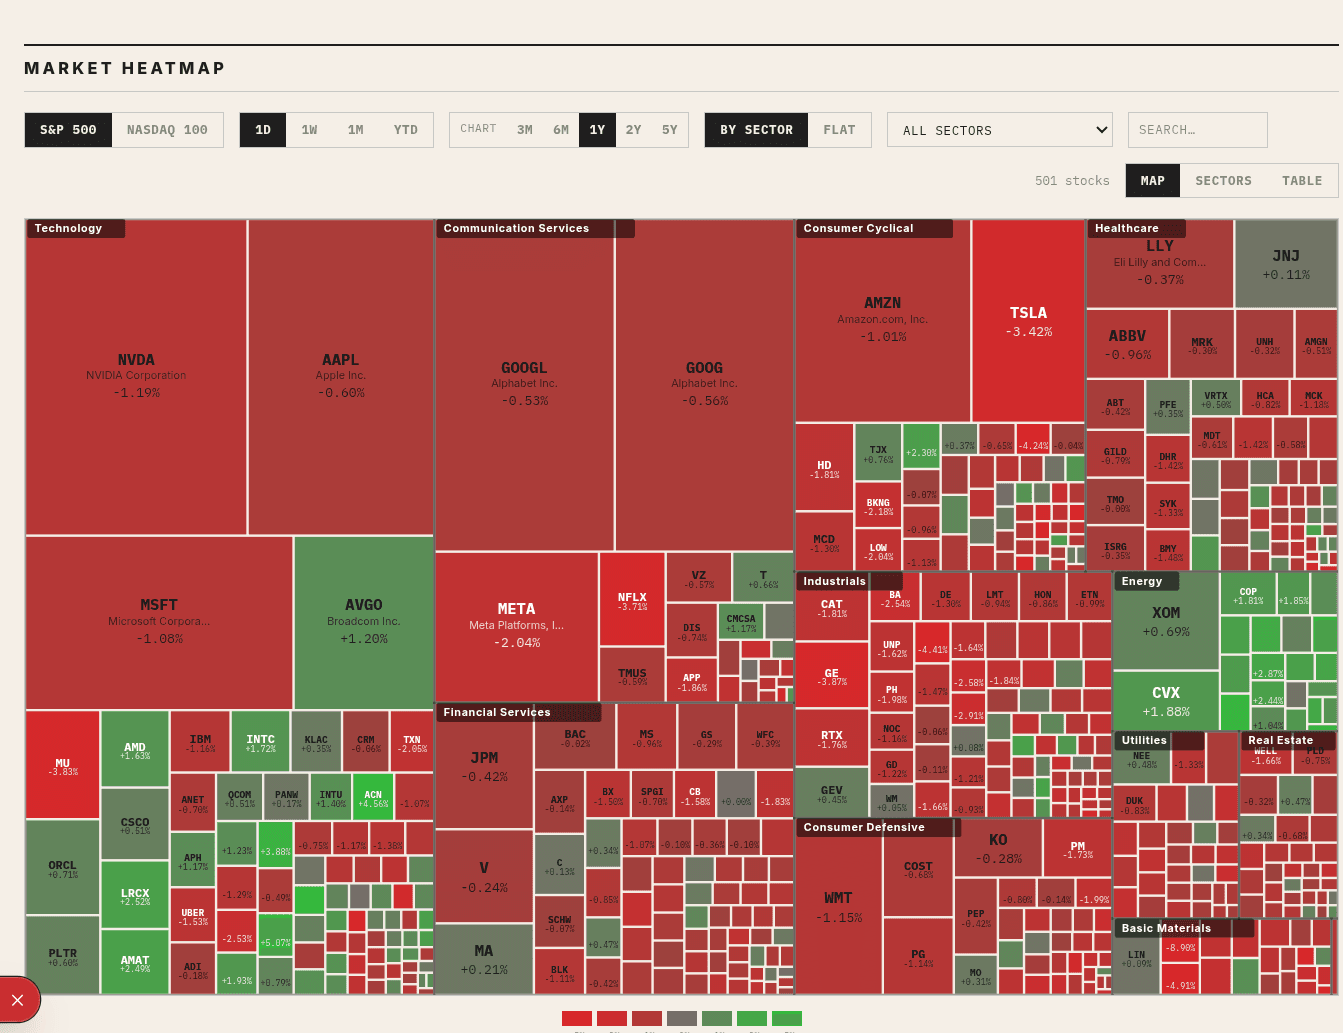
Open Market Heatmap →
Watchlist
A personalized watchlist with grid and chart views. Each card shows a TradingView price chart with moving average overlays, a revenue & profit mini-chart (net income, margin trend, revenue bars), and a dividend history chart with yield and growth indicators. Toggle visibility layers (MA, Revenue, Dividends), switch time periods, and manage tickers. A persistent sidebar tracks real-time prices and daily changes.
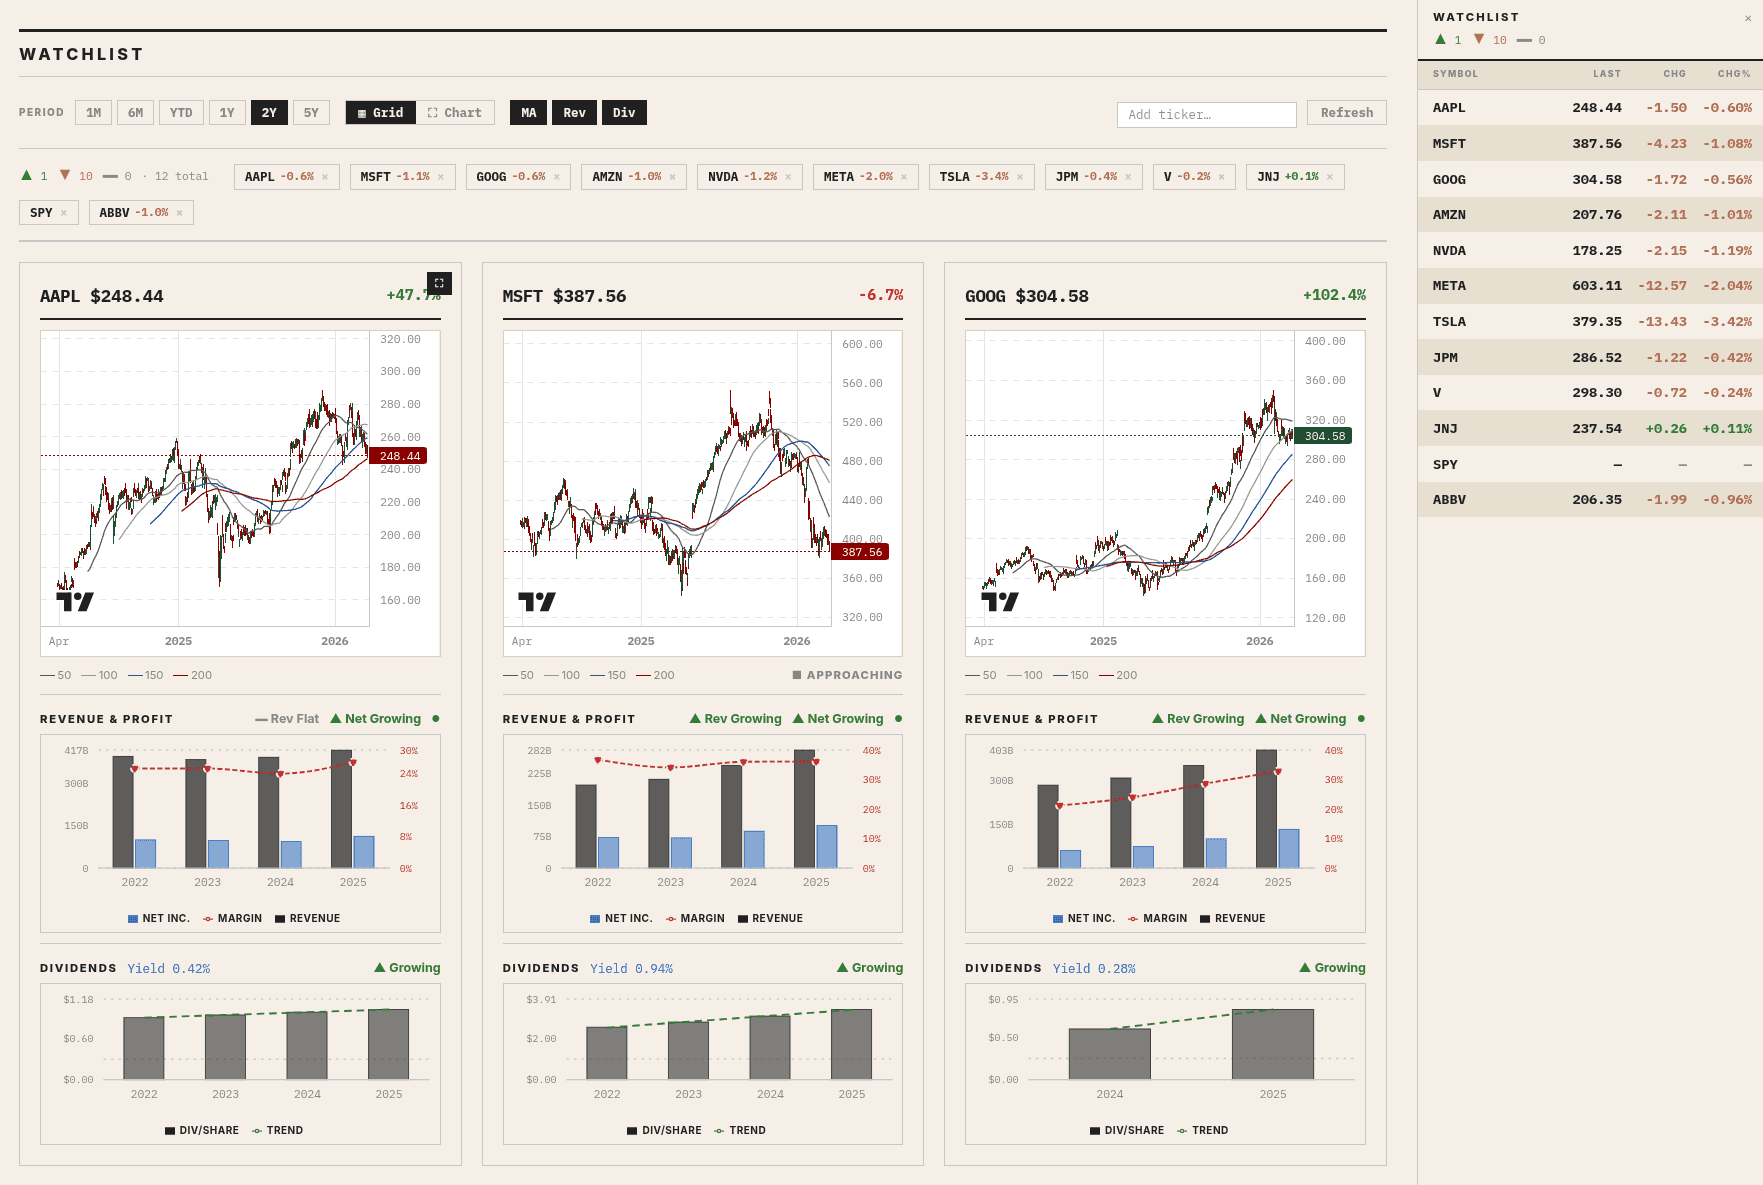
Open Watchlist →
Stock Comparison
Compare any set of stocks side by side. Summary cards show price, YTD/1Y performance, 52-week range, and sector/industry. Includes a normalized price chart (rebased to 100) for direct performance comparison, a multi-period return table (1M through 5Y), a fundamentals radar chart (profit margin, operating margin, gross margin, ROE, ROA, liquidity), and a risk vs. return scatter plot.
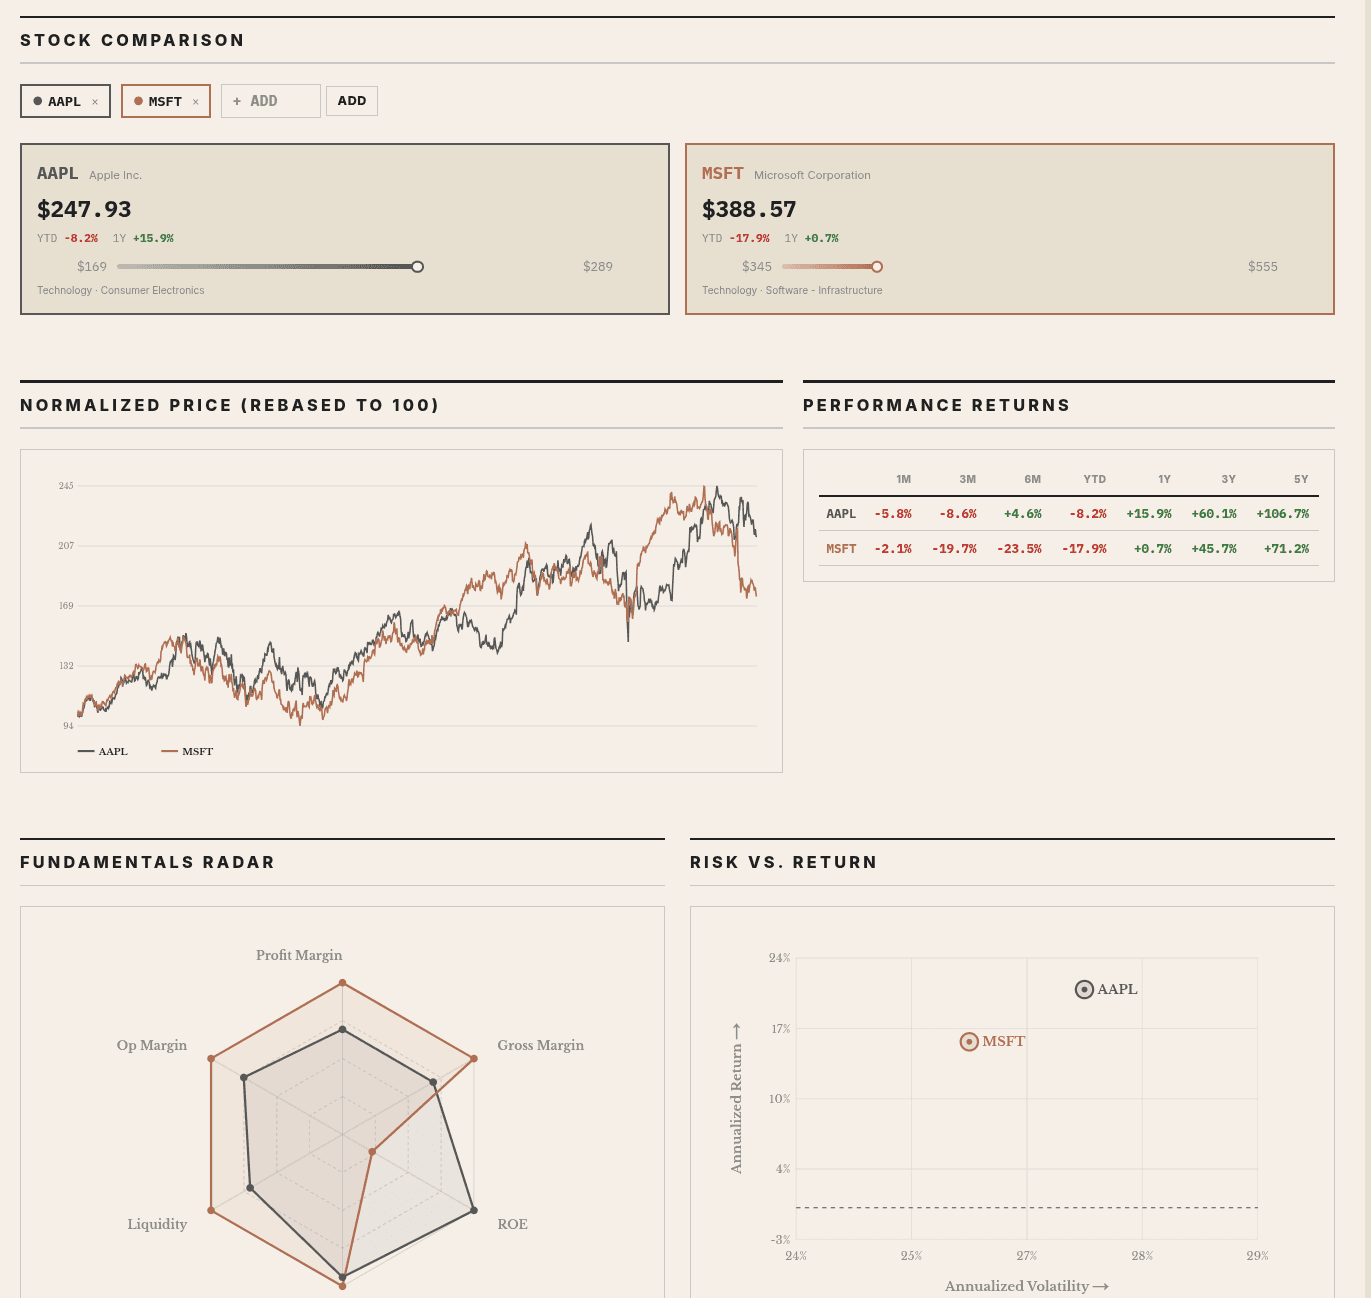
Open Stock Comparison →
Sector Analysis
Cross-sector correlation analysis across all 11 S&P 500 sectors. Features a color-coded correlation matrix showing how sectors move together, with cap-weighted and equal-weighted views over 3M–5Y windows. Includes normalized sector performance charts (rebased to $100) to visualize cumulative returns, helping identify diversification opportunities and hedging strategies.
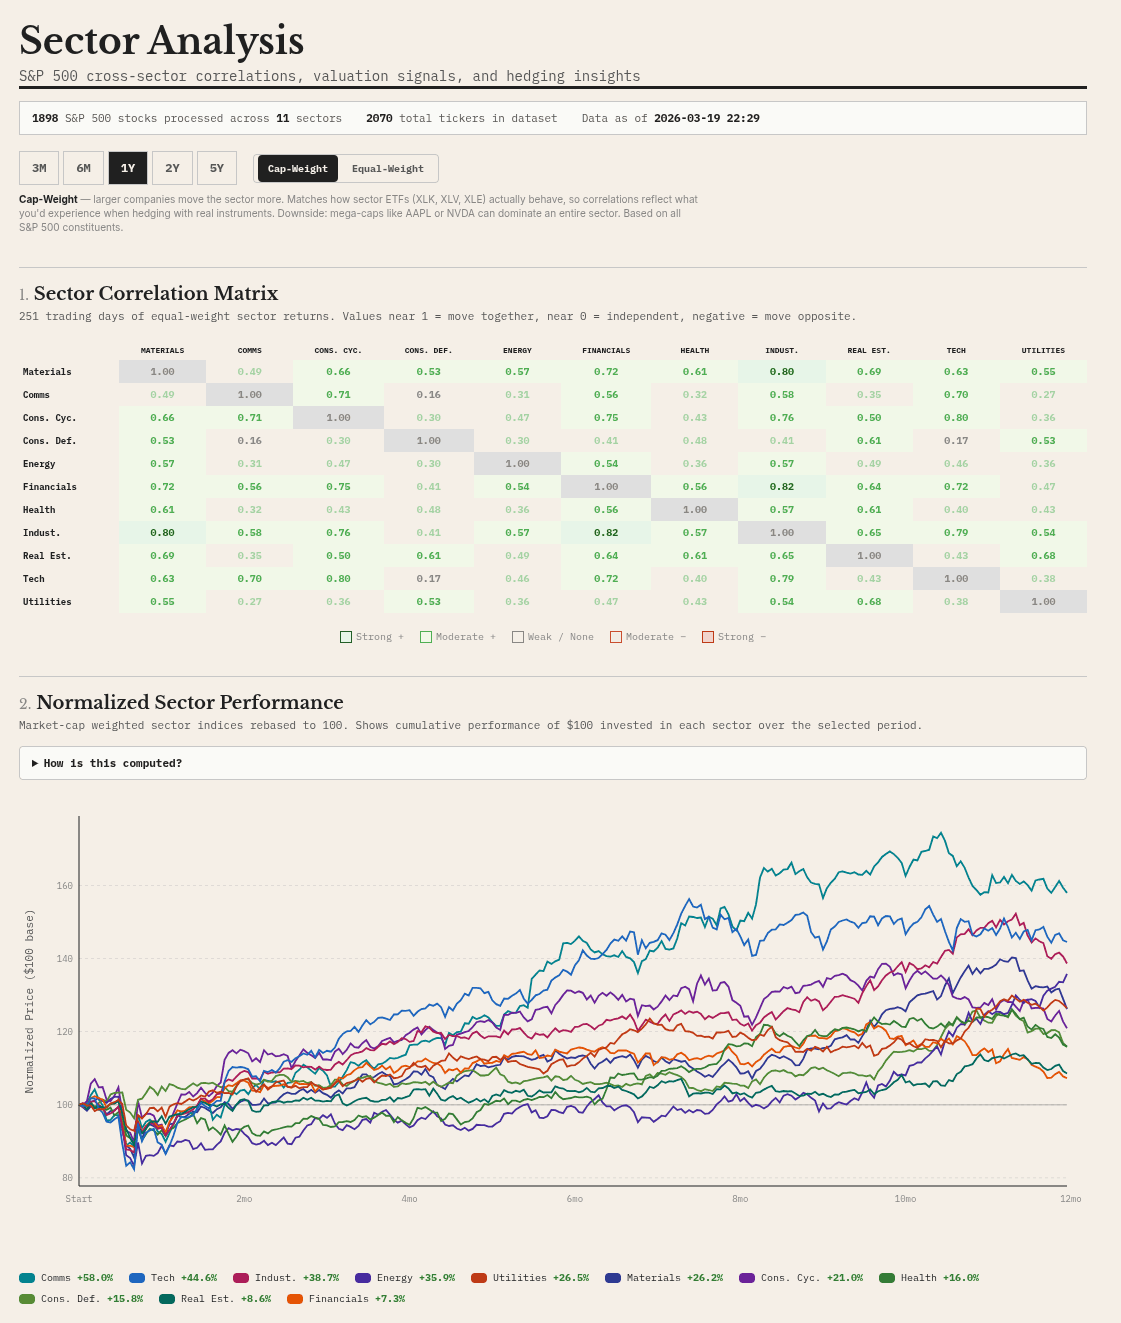
Open Sector Analysis →
Sector Hexagonal Density Plot
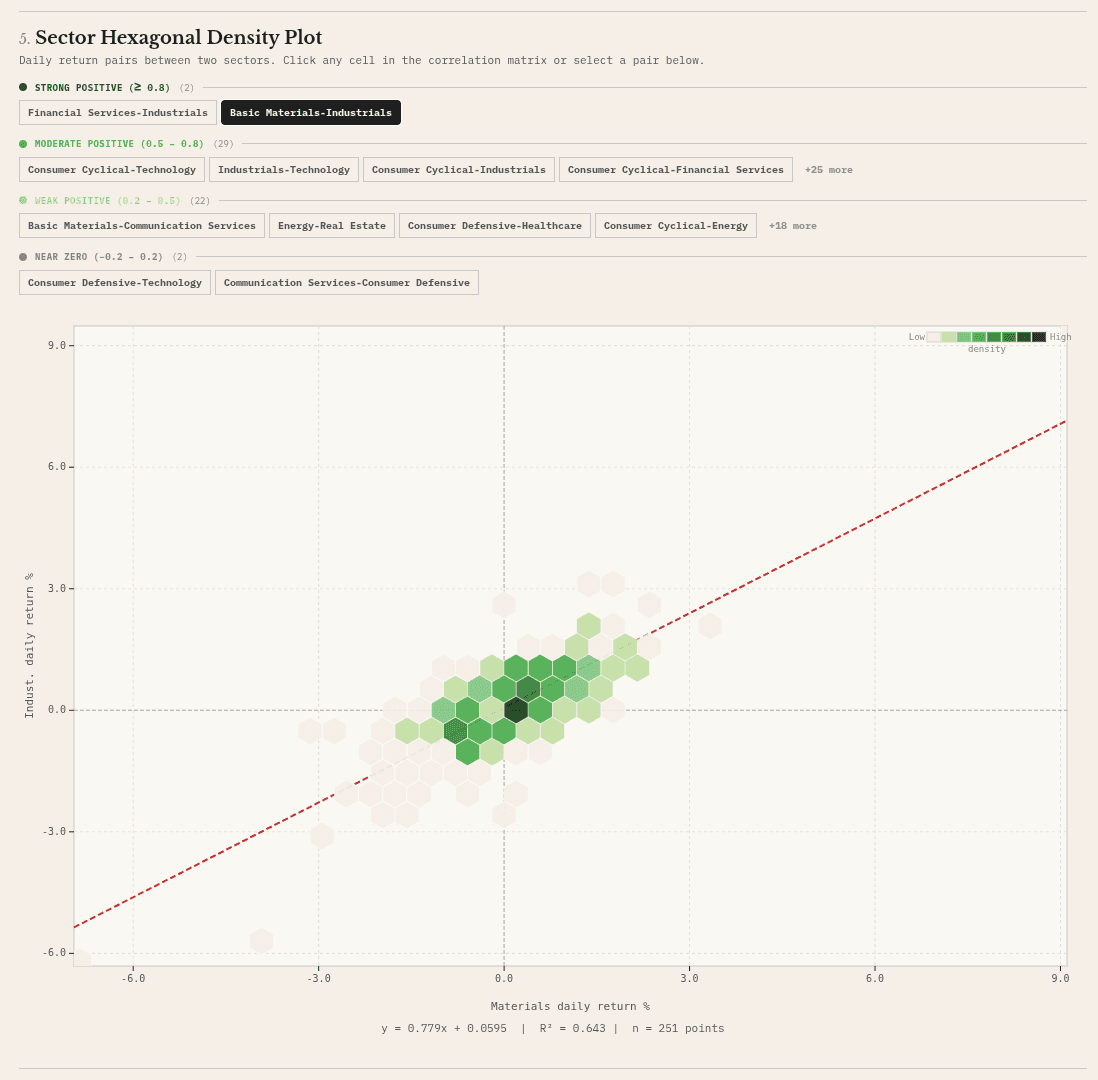
An interactive hexbin scatter plot showing daily return correlations between any two sectors. Pairs are categorized by correlation strength (strong positive, moderate, weak, near zero) and selected via the correlation matrix or quick-pick buttons. Displays regression line, R² value, and data point count — useful for visualizing sector co-movement patterns and tail-risk events.
Open Sector Hexagonal Density Plot →
Congress Trading Tracker
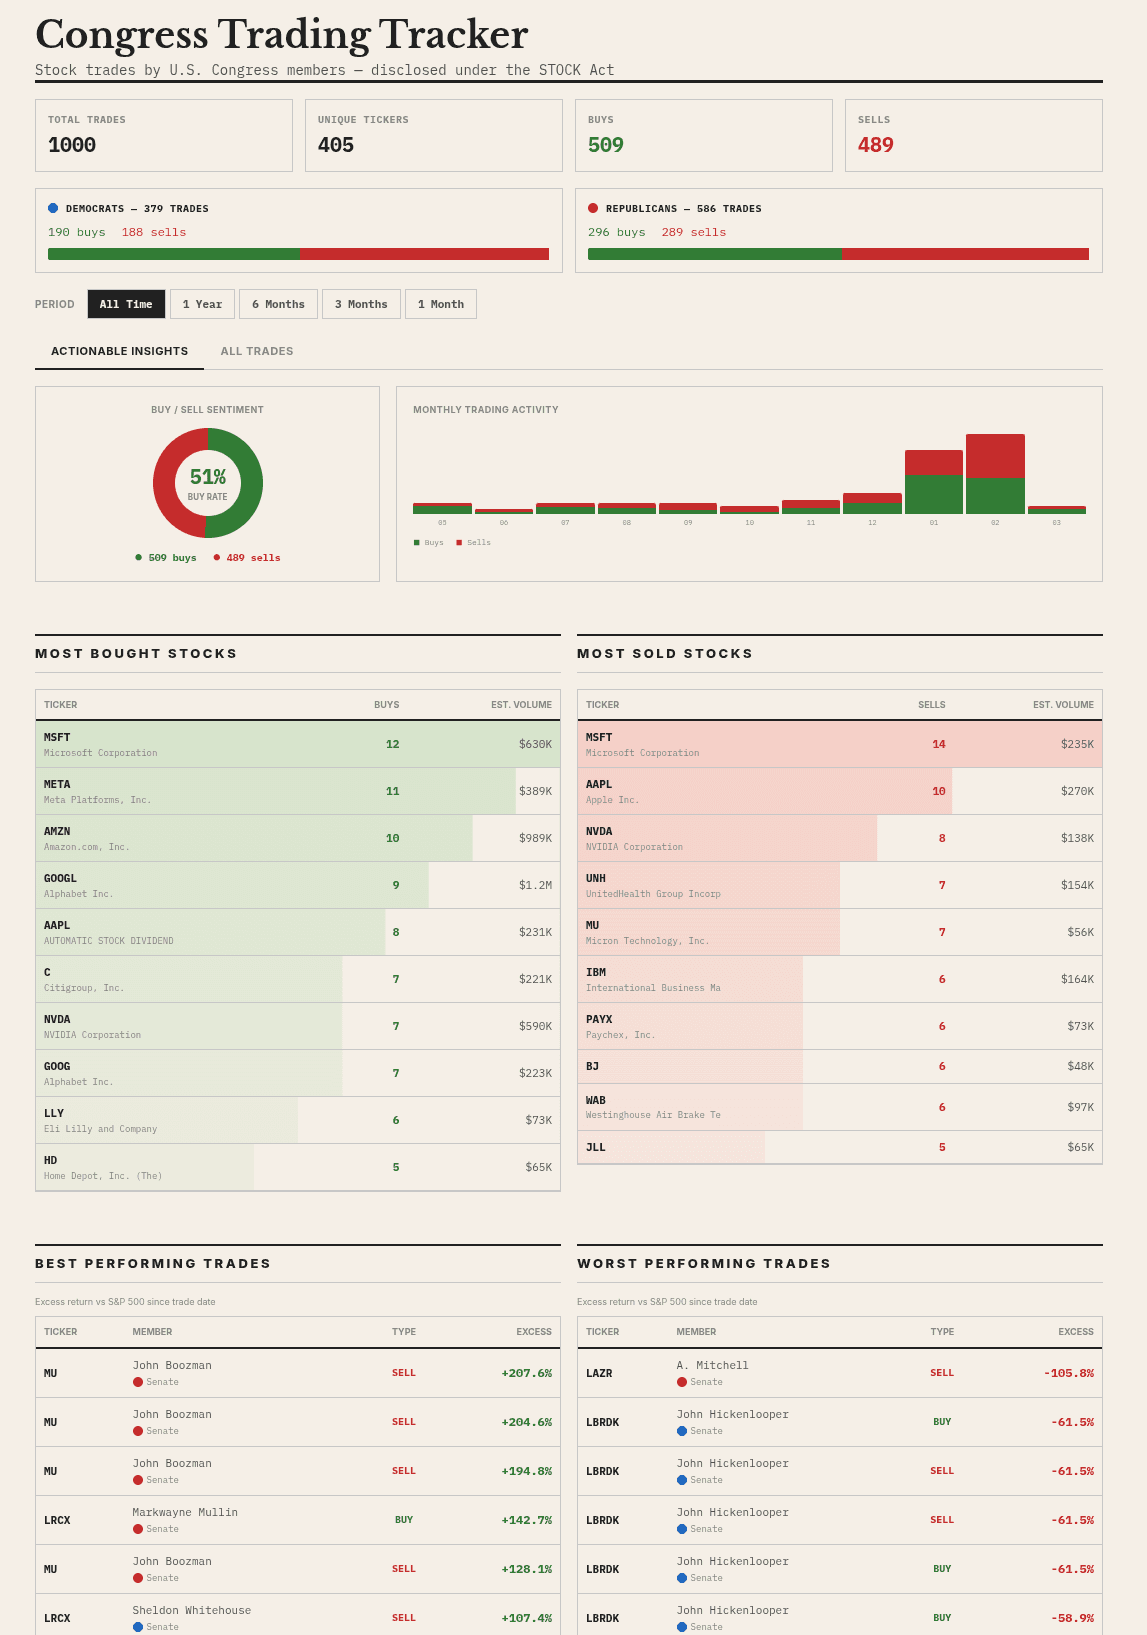
Track stock trades disclosed by U.S. Congress members under the STOCK Act. Dashboard shows total trades, unique tickers, buy/sell breakdown by party (Democrats vs. Republicans), buy/sell sentiment donut chart, and monthly trading activity. Tables highlight the most bought and most sold stocks with estimated volumes, plus best and worst performing trades ranked by excess return vs. S&P 500.
Open Congress Trading Tracker →
Tech Stack
| Layer | Technology |
|---|---|
| Frontend | Next.js 16, React 19, TypeScript, Tailwind CSS |
| Backend | Python 3, Flask 3, pandas, NumPy, yfinance |
| Charts | TradingView Lightweight Charts, Recharts, D3.js |
| Data | Yahoo Finance API, batch caching, scheduled updates |
| Infrastructure | Docker, Docker Compose, Nginx reverse proxy |
Community & Open Source
Shounya is MIT-licensed and open source. Join our Discord community to discuss features, report bugs, and connect with other users.
Data sourced from Yahoo Finance · Updated periodically · Not financial advice